Restaurant Write-Off Acts:
Automated Loss Tracking
Identify loss causes, reduce waste, and ensure transparent tracking in your restaurant business with systematic write-off documentation.
Every restaurant loses money through spoilage, breakage, and waste. Without proper documentation, you don't know how much you're losing or why. Restaurant write-off acts track every discarded item, revealing patterns that help reduce losses significantly.
The Hidden Cost of Undocumented Waste
When staff throw away spoiled food without recording it, that loss becomes invisible. Multiply small daily losses across weeks and months - the numbers shock most restaurant owners. Proper loss tracking food service reveals the true extent.
What Happens Without Tracking
Industry Average: Restaurants waste 4-10% of purchased food. For a restaurant spending $50k monthly on ingredients, that's $2,000-$5,000 thrown away each month.
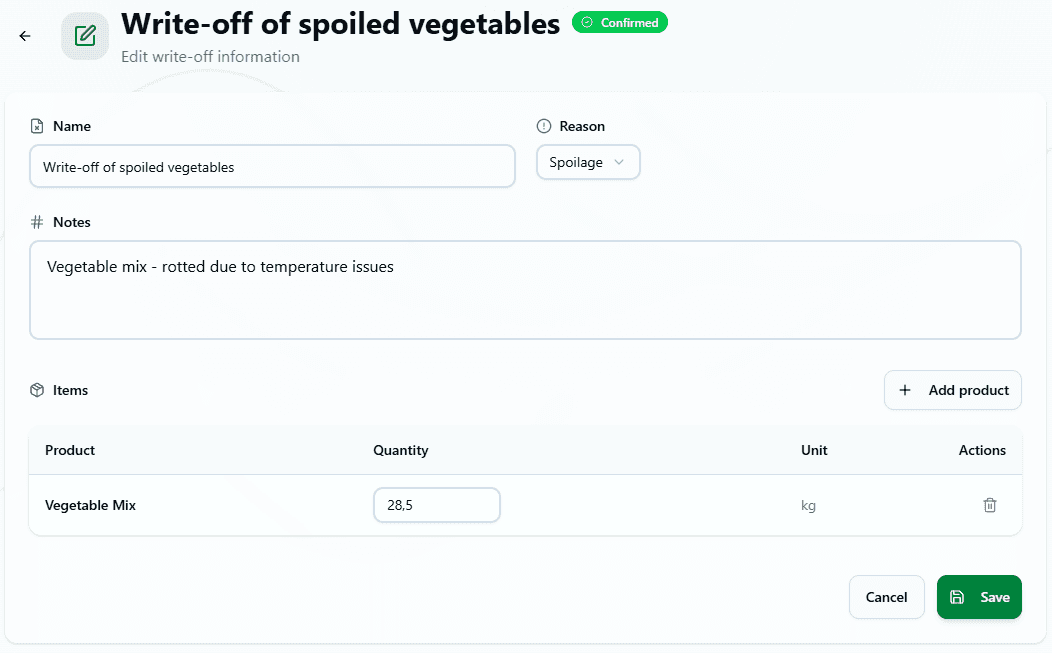
Creating Write-Off Documents
A digital HoReCa system makes documenting waste simple and fast:
Write-Off Information
Document Details
- • Write-off date
- • Storage location
- • Overall reason/note
- • Who documented it
Per Product
- • Product name
- • Quantity wasted
- • Unit of measure
- • Specific reason
- • Photo (optional)
- • Comments
Quick Process: Find expired items during shift, open app, scan/select products, add quantities, snap photos, submit. Takes 2-3 minutes vs 10+ with paper forms.
Six Common Waste Reasons
Track specific reasons for better waste control analysis:
🦠 Spoilage
Most CommonProducts went bad before use - mold, smell, texture changes
📅 Expired
PreventablePast expiration date, must discard for safety
❌ Defective
QualitySubstandard quality, doesn't meet standards
💥 Breakage
AccidentalDropped, broken, damaged packaging
📉 Shrinkage
NaturalNatural moisture/weight loss during storage
📝 Other
VariousMisc reasons - over-production, test batches, samples
Photo Documentation
Adding photos to product write-off automation provides accountability and analysis:
Why Photos Matter
- 📸Proof of actual damage/spoilage
- 👀Visual record for management review
- 🔍Identify recurring problems
- 📊Support insurance claims if needed
- 👨🏫Training examples for staff
What to Photograph
- →Moldy or discolored food
- →Expiration date labels
- →Broken/damaged packaging
- →Quality defects
- →Quantity being discarded
Pro Tip: Take photos before disposal. Clear images showing the problem help justify losses during audits and identify supplier quality issues.
Automatic Inventory Updates
When you confirm a write-off act, the system updates everything automatically:
Reduces Stock Levels
Product quantities decrease by exact write-off amounts
Records Movement History
Creates permanent audit trail with who, what, when, why
Updates Loss Analytics
Waste appears in dashboard reports and trend analysis
Locks Document
Prevents editing after confirmation to maintain accurate records
Important: Confirming a write-off is permanent. Double-check quantities and reasons before confirming - you cannot undo or edit afterward.
Loss Analytics & Reporting
The system automatically analyzes waste patterns for actionable insights:
Dashboard Metrics
By Product
See which items get wasted most - often reveals over-ordering
By Reason
Track if spoilage, expiration, or breakage dominates your losses
By Time Period
Compare week-to-week and month-to-month trends
By Staff Member
Identify who's documenting waste and spot training needs
Real-World Examples
Daily Produce Spoilage
SpoilageAction: Reduced daily produce order by 15%
Dropped Wine Bottles
BreakageAction: Provided carrying crates, staff retraining on handling
Expired Dairy Products
ExpiredAction: Implemented FIFO labels, reduced order frequency
Best Practices
- •Document immediately: Record waste as soon as discovered, don't wait until end of day
- •Always specify reason: Generic "waste" doesn't help identify problems
- •Take clear photos: Visual evidence supports claims and helps analysis
- •Review weekly: Look for patterns in waste reports every week
- •Track small amounts: Even 100g of expensive items adds up over time
- •Use comments liberally: Explain unusual circumstances or prevention ideas
- •Don't skip documentation: Every undocumented loss is invisible money disappearing
Reducing Waste Through Data
Once you track waste systematically, patterns emerge that drive improvements:
Pattern: Same Products Spoil Weekly
Analysis shows lettuce waste every Monday morning
Solution: Reduce weekend order by 30%, order fresh Monday instead
Pattern: High Breakage in Evening Shift
Most broken items documented 7-11 PM
Solution: Night crew needs handling training, better storage lighting
Pattern: Specific Supplier Products Defective
One supplier's produce consistently spoils fast
Solution: Switch suppliers or negotiate quality improvements
Pattern: Seasonal Waste Spikes
Summer waste 40% higher than winter
Solution: Reduce order quantities during slow season, improve AC
Benefits of Systematic Tracking
Financial Impact
- • Know exact waste costs
- • Identify biggest loss sources
- • Reduce waste by 30-50%
- • Better budget forecasting
- • Improved profit margins
Operational Benefits
- • Staff accountability improves
- • Better inventory accuracy
- • Supplier quality tracking
- • Complete audit compliance
- • Data-driven decisions
System Integration
Write-off acts connect with your entire restaurant operation:
📦 Product Catalog
Select products, automatic cost calculations from current prices
🏪 Warehouses
Track which storage location waste came from
📊 Dashboard
Loss metrics appear in main analytics and alerts
📋 Inventory
Discrepancies from counts can create write-offs
Stop Invisible Losses
Every piece of undocumented waste is money disappearing without trace. Restaurant write-off acts make losses visible, trackable, and most importantly - reducible.
From photo documentation to automatic analytics, reason tracking to trend analysis - take control of waste and protect your profits.
Ready to reduce waste? Start tracking write-offs systematically today.
Free to start. No credit card required.
By continuing you agree to our Terms.